Job Costing
Workflow
Know what every job is really costing you.
Turn job-level financial and operational data into clear, actionable profitability reporting.
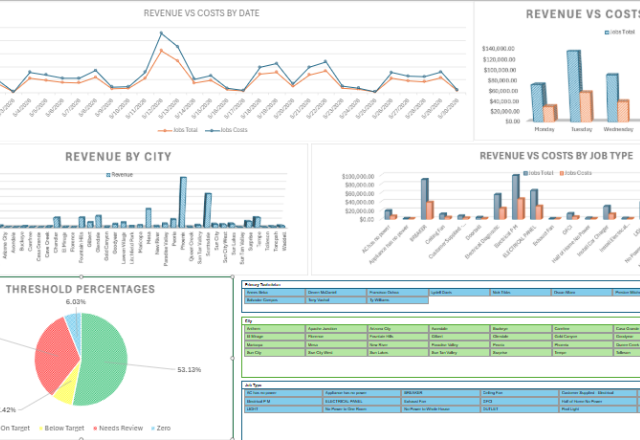
Stop piecing together job profitability manually.
Job costing can require information from multiple sources — jobs, job items, payments, purchase orders, technician activity, and accounting data. When that information lives in separate reports, determining the true cost and profitability of a job becomes a time-consuming process of exporting, matching, calculating, and reconciling data.
The Calculated Co. Job Costing Workflow brings that information together into an organized reporting process designed around your business.
From raw data to business insight.
📥 1. Import & Organize
Bring your job and financial data into a standardized structure. The workflow can organize:
🧮 2. Calculate Job Costs
The workflow calculates costs associated with each job — no manually maintained totals. This can include:
📊 3. Determine Profitability
Once revenue and costs are organized, the workflow calculates the financial performance of each job.
🔍 4. Analyze Variances & Performance
Job-level data can be analyzed across departments, technicians, and job types to answer:
- ✦Which jobs are most profitable?
- ✦Where are costs running higher than expected?
- ✦Which departments produce the strongest margins?
- ✦How are technicians performing?
- ✦Where are material costs affecting profitability?
A centralized view of job-level financial performance.
Job Costing
See revenue, costs, and profitability at the individual job level.
Material & Purchase Costs
Track material, equipment, purchase order, and other applicable costs associated with each job.
Labor & Technician Activity
Connect technician activity and labor-related information to job performance where source data supports it.
Department Analysis
Compare performance across departments and identify differences in revenue, costs, and profitability.
Profitability Reporting
Evaluate gross profit and profitability using calculated job-level financial data.
Variance Analysis
Identify jobs and categories where actual results differ from expectations or established benchmarks.
Management Dashboards
Transform detailed job data into summary information that management can use to evaluate performance.
The same underlying data supports multiple views of your business.
Built for the teams that need better job data.
Accounting & Finance Teams
For accountants, accounting clerks, controllers, and finance teams who need reliable job-level financial reporting without manually combining multiple reports.
Service Businesses
Especially useful for businesses where revenue, materials, labor, purchasing, and technician activity all contribute to the profitability of individual jobs.
Business Owners & Managers
For leaders who need a clearer understanding of which jobs, departments, and activities are actually driving profitability.
This isn’t a one-size-fits-all job costing workflow.
Your business has its own departments, chart of accounts, job structure, reporting requirements, and operating processes. Calculated Co. customizes the workflow around the systems and information your business already uses.
For example, a service business may need to analyze departments such as Plumbing, Electrical, Drains, and Appliance — while another organization may have completely different departments and cost structures.
It’s to make the information inside it more useful.
Ready to see what your jobs are really making?
Stop spending hours piecing together job reports. Build a better way to understand your profitability.
Every project is unique. After learning about your workflow and objectives, I’ll provide a customized proposal outlining the recommended solution, timeline, and project investment.